Monitoring, or tracking metrics of an application helps you get a clear, complete picture of what’s happening — from system stability to user behaviour.
On the application side, this observability is achieved by collecting metrics.
Monitoring, or tracking metrics of an application helps you get a clear, complete picture of what’s happening — from system stability to user behaviour.
On the application side, this observability is achieved by collecting metrics.
A metric is a quantitative measure of some aspect of an application’s behaviour that changes over time. As an example, let’s look at a few common metrics from a Java application that uses Spring Boot Actuator and Micrometer.
| Metric name | Description |
|---|---|
| http_server_requests_seconds_count | The number of requests received by the server |
| process_uptime_seconds | The number of seconds since the application was started |
| logback_events_total | The number of logged events |
Metrics are exposed at an endpoint, for example /actuator/prometheus, where they can be scraped for further processing. On an HTTP request with the GET method, the application returns its metrics in the following format:
http_server_requests_seconds_count{error="none",method="GET",outcome="SUCCESS",status="200",uri="/monitoring",} 2.0
http_server_requests_seconds_count{error="none",method="POST",outcome="SUCCESS",status="200",uri="/login",} 10.0
process_uptime_seconds 109122.326
logback_events_total{level="warn",} 0.0
logback_events_total{level="debug",} 0.0
logback_events_total{level="error",} 0.0
logback_events_total{level="trace",} 0.0
logback_events_total{level="info",} 150.0A widely used tool for collecting metrics from Java applications is Prometheus. In addition to collecting metrics, Prometheus can be configured for alerting — notifications about important events, for example by sending an email to an administrator.
Next, metrics can be sent to a data visualization tool — Grafana, where you can build charts and diagrams based on those metrics, creating dashboards — panels that present metrics in a compact and clear way. In addition, like Prometheus, Grafana also supports alerting.
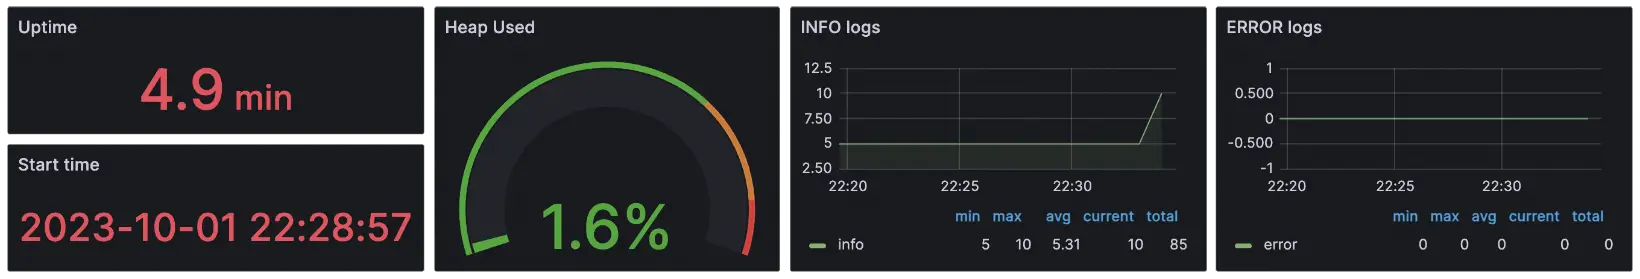
Based on metrics, you can draw conclusions about an application’s health, run performance testing and even detect bugs.
Imagine you’re watching the application’s memory usage metric and you notice that it keeps increasing steadily, regardless of objective factors such as a growing number of active users.
This behavior may indicate a memory leak — errors in how the application manages, consumes, and releases the memory allocated to it.

Уровень повышен!