Request tracing

Request trace through Service A, Service B, and database with latency panel.

Request tracing tracks how a request travels from service to service in distributed systems.

The related data helps with performance testing, finding bottlenecks, and optimizing application behavior.

Span

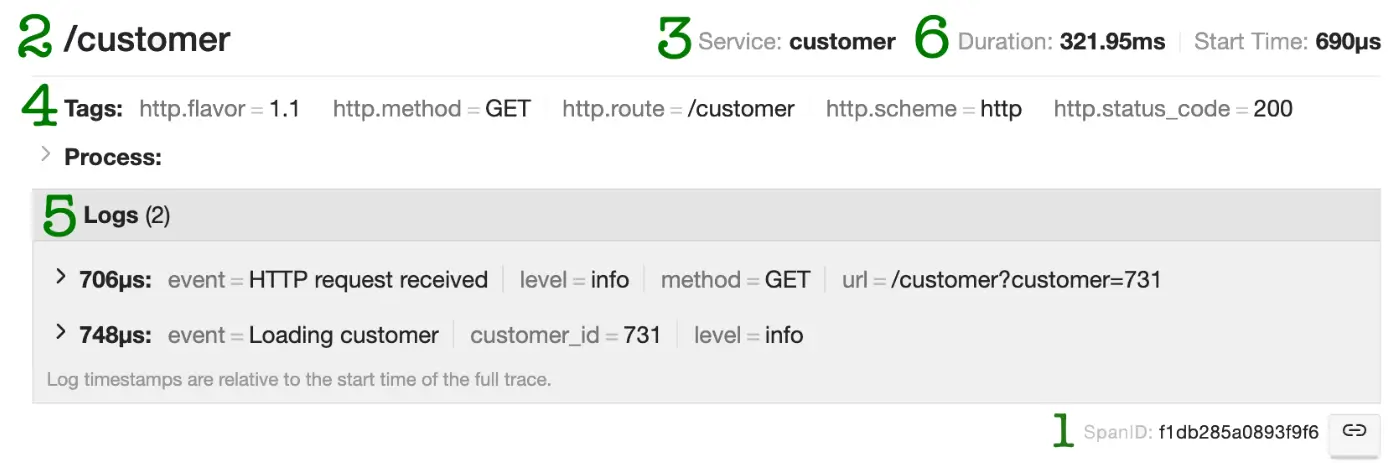
A span is a logical unit of work within a service and includes:

  1. ID, for example, f1db285a0893f9f6
  2. Operation name performed by the service
  3. Service name the span belongs to
  4. Tags: additional data in the form «key = value» used to filter spans
  5. Logs: information about the operation or an error message
  6. Time: the start time and duration of the operation

Example span for a customer data request operation

span-example

Trace

A trace, in turn, shows the path a request takes through the system and consists of many spans.

Spans can reference each other, forming a directed acyclic graph. The links between spans show the order in which operations run.

trace-example

Trace export pipeline diagram

Let’s look at a minimal component setup for request tracing with Jaeger and OpenTelemetry.

The application integrates the OpenTelemetry library, which provides trace generation and export. The application traces are sent to Jaeger Collector, which then stores them in a database.

The user accesses Jaeger UI, where queries made by Jaeger Query to the database allow them to find the right traces by tags and other parameters and analyze the data.

jaeger-schema

Trace analysis

A good starting point for analyzing tracing data is the execution time of an operation, also known as operation latency.

The maximum allowed latency is described in non-functional requirements and usually doesn’t exceed 1–2 seconds.

For example, an artificially high observed latency can be caused by an unoptimized SQL query; optimizing it can improve system performance.

You can also look for errors during certain operations — these spans are marked in Jaeger UI with an exclamation icon

You can drill down into each span to read logs and other useful details.

Jaeger UI tracing example
Example trace in Jaeger UI
Task
Task available to premium users!
Sidebar arrow